

CUHK
News Centre
CUHK ISEIS Analyzes "6.24" Landslide in Maoxian, Sichuan Province with Satellite Images
After a landslide occurred above Xinmo village in Maoxian, Sichuan on 24 June 2017, the InSAR (Interferometric Synthetic Aperture Radar) team led by Prof. Lin Hui, Director of the Institute of Space and Earth Information Science (ISEIS) at The Chinese University of Hong Kong (CUHK), downloaded the historical satellite imagery of the landslide area. Based on analysis of the data from the Sentinel-1 satellite of the European Space Agency from October 2014 to June 2017, it was found that the upper part of the landslide had previously had a directional movement. In addition, the time-series deformation had a strong seasonal trend, which was probably caused by the local glacial seasonal changes. The results obtained were clearly recognizable by the landslide expert Academician Cui Peng of the Chinese Academy of Sciences. The results are consistent with their field information, and the technology can be used to monitor the potential risk. Sichuan Province is preparing for landslide hazard inspection, and the Institute of Mountain Hazards and Environment, Chinese Academy of Sciences and ISEIS are proposing collaboration in the use of various high-tech means such as InSAR to assist in the inspection.
According to the analysis by Academician Cui Peng’s research team, cracks were shown on the edge of the mountain in the landslide area on an image in 2003. It could have been caused by the Lianxi 7.5 earthquake in 1933 or the Songpan 7.2 earthquake in 1976, under the original structure of the surface, but most likely by the Lianxi 7.5 earthquake in 1933. Recently, due to the frequent rainfall in Maoxian, water went into the rock fractures, forming a water head in the cracks. In the bottom of the sliding mass, the structural surface strength decreased. This ultimately caused the rocks to break through the resistant layers under the action of gravity and fall rapidly. Dozens of residents and hundreds of people were buried.
InSAR technology utilizes multiple SAR images to extract slow ground subsidence and infrastructure deformation information. This technology, similar to the Computed Tomography (CT) technique in medical use, can scan urban infrastructures over large areas with centimeter to millimeter deformation estimation accuracy using satellite images. This data analysis is conducted by the Skysense software jointly developed by ISEIS and HongDu Skysense (Shenzhen) Technologies Co. Ltd. The InSAR technology, combining ground investigation technology, can be used to identify potential risks relevant to building collapse, subsidence, landslides and other geological hazards, providing basic data information for early-warning.
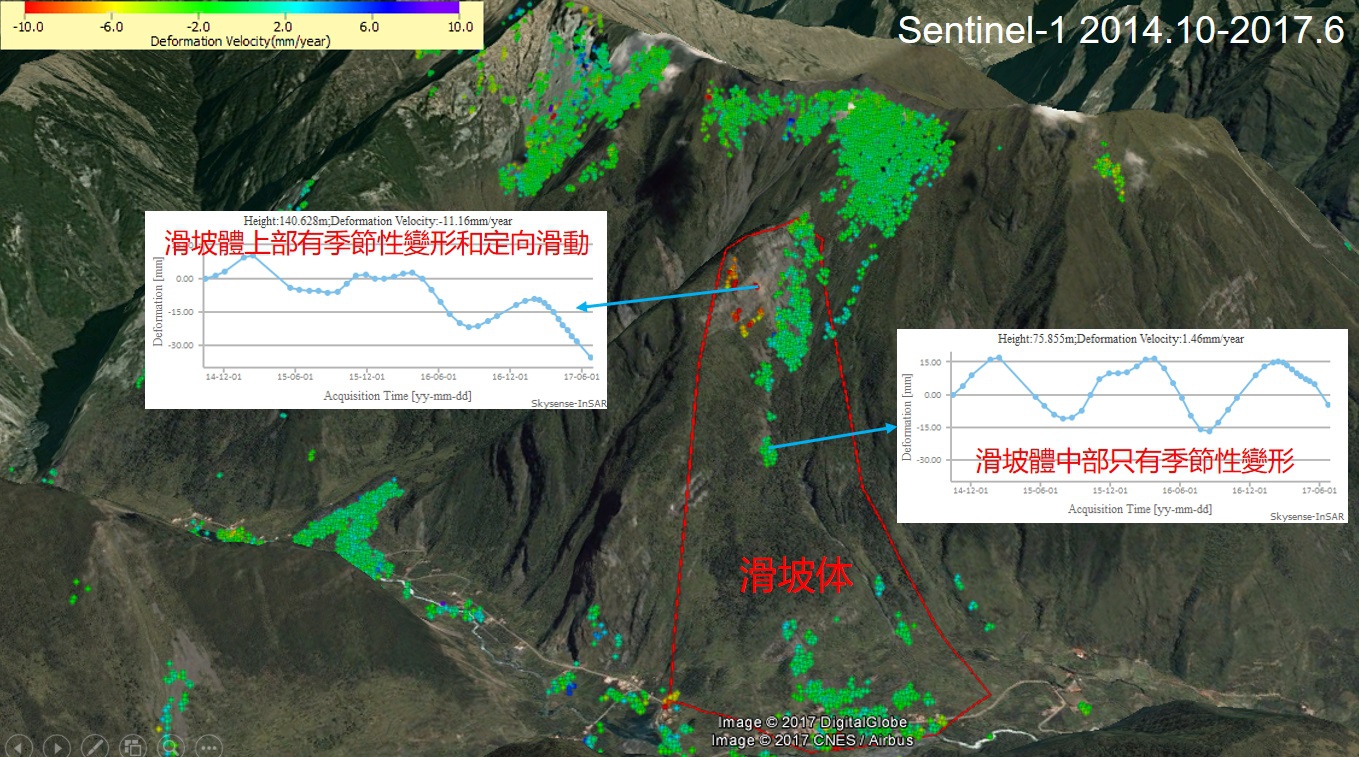
Mean deformation velocity map 1: Before the landslide, it was found that the upper part of the landslide had previously had a directional movement according to the ESA Sentinel-1 satellite image. In addition, the time-series deformation had a strong seasonal trend, which was probably caused by the local glacial seasonal changes.
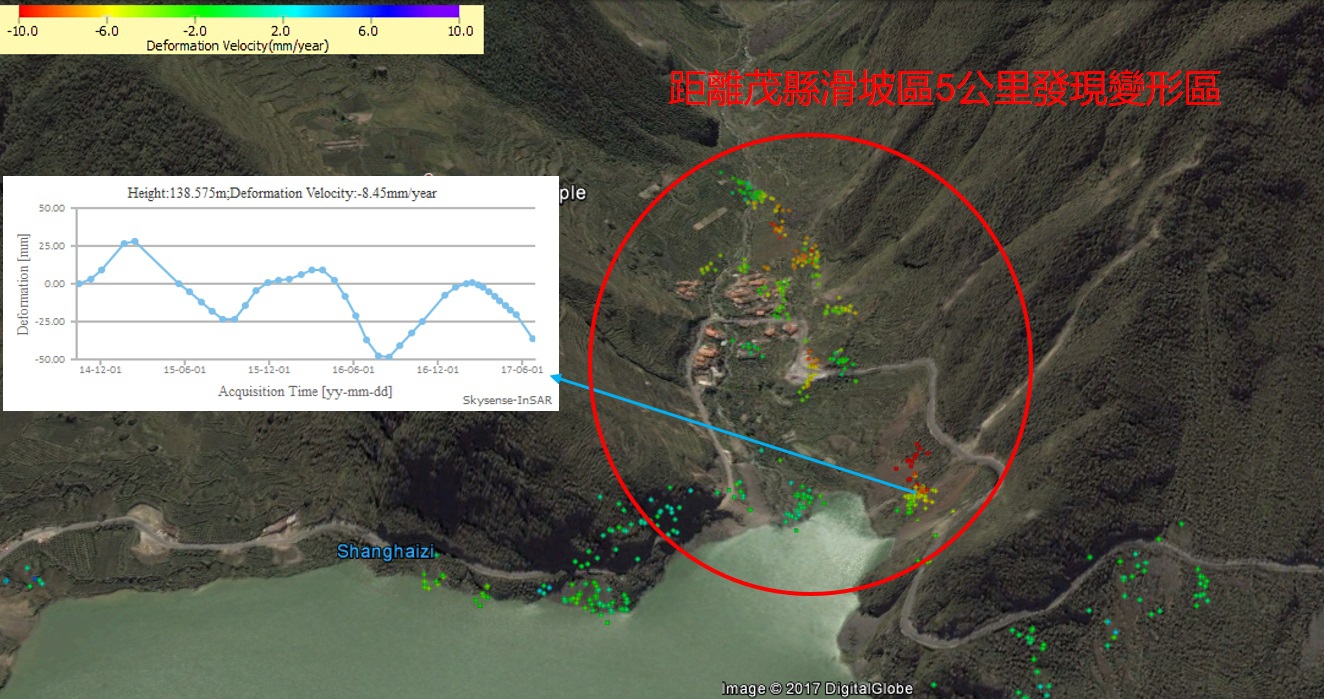
Mean deformation velocity map 2: Directional movements were also found within a 5 km radius of the landslide area in Maoxian (in red circle).